May 6, 2013

偵測目錄變動並自動執行指令

最近比較少用 IDE 後,coding 少了些自動化的回饋機制總覺得缺了點什麼,手動執行不知不覺也浪費了許多時間

想了想, 有些重複流程是可以用程式自動化的, 只要有程式來偵測目錄變動並自動執行程式就夠了,在 linux 裡確沒找到相關的工具(inotify-tools), 於是用 Go 做了一個命令列工具 watchf ,能彈性組合命令, 也可以在多個作業系統上使用

Usage

Usage:
  watchf [options]
Options:
  -V=false: Show debugging messages
  -c=[]: Add arbitrary command (repeatable)
  -e=[all]: Listen for specific event(s) (comma separated list)
  -f=".watchf.conf": Specifies a configuration file
  -i=0: The interval limit the frequency of the command executions, if equal to 0, there is no limit (time unit: ns/us/ms/s/m/h)
  -p=".*": File name matches regular expression pattern (perl-style)
  -r=false: Watch directories recursively
  -s=false: Stop the watchf Daemon (windows is not support)
  -v=false: Show version and exit
  -w=false: Write command-line arguments to configuration file (write and exit)
Events:
     all  Create/Delete/Modify/Rename
  create  File/directory created in watched directory
  delete  File/directory deleted from watched directory
  modify  File was modified or Metadata changed
  rename  File moved out of watched directory
Variables:
  %f: The filename of changed file
  %t: The event type of file changes

Example 1

程式碼存檔時從另一個 terminal 看到程式碼錯誤分析、compiler 編譯訊息跟測試結果

以Go為例:

watchf -e "modify,delete" -c "go vet" -c "go test" -c "go install" -p "\.go$"

以Java為例:

watchf -r -i 5s -e "modify,delete" -c "mvn test" -p "\.java$"

Example 2

放置一個背景程式&偵測當前目錄與子目錄的檔案變動, 接著自動同步檔案到另一個目錄(或著遠端目錄)

watchf -r -c "rsync -aq $SRC $DST" &

停掉背景程式, 只要在同個執行目錄裡下watchf -s命令

Example 3

將常用參數寫入設定檔,之後只要在同個執行目錄裡下watchf命令不用給定參數

watchf -e "modify,delete" -c "go vet" -c "go test" -c "go install" -p "\.go$" -w

Apr 21, 2013

golang - Flag 隱藏選項 -help 與 -h

預設的 FlagSet 裡藏了兩個預設選項 -help 跟 -h, 在用 flag 時可以少寫一點 boilerplate code

src/pkg/flag/flag.go

func (f *FlagSet) parseOne() (bool, error) {
    // ignored
    flag, alreadythere := m[name]
    if !alreadythere {
        if name == "help" || name == "h" { // special case for nice help message.
            f.usage()
            return false, ErrHelp
        }
        return false, f.failf("flag provided but not defined: -%s", name)
    }
    // ignored
}

上面那段 code 的意思是程式裡沒有設定 h 或 help 選項,若是執行的時候從 command-line 解析到 h 或 help 就印出 usage (然後 parserOne() 的 caller 收到 ErrHelp 就會結束程式)

demo1.go

package main

import (
    "flag"
    "fmt"
)

func main() {
    optionA := flag.String("A", "", "help message for A")
    optionB := flag.String("B", "", "help message for B")
    flag.Parse()
    fmt.Printf("optionA=%s, optionB=%s\n", *optionA, *optionB)
}

執行結果

$ ./demo1 -h
Usage of ./demo1:
  -A="": help message for A
  -B="": help message for B

若希望能顯示 h 選項,可以改寫預設的 flag.Usage

demo2.go

package main

import (
    "flag"
    "fmt"
    "os"
)

func main() {
    optionA := flag.String("A", "", "help message for A")
    optionB := flag.String("B", "", "help message for B")

    flag.Usage = func() {
        fmt.Fprintf(os.Stderr, "Usage of %s:\n", os.Args[0])
        flag.PrintDefaults()
        fmt.Fprintln(os.Stderr, "  -h   : show help usage")
    }

    flag.Parse()
    fmt.Printf("optionA=%s, optionB=%s\n", *optionA, *optionB)
}

執行結果

$ ./demo2 -h
Usage of ./demo2:
  -A="": help message for A
  -B="": help message for B
  -h   : show help usage

Apr 19, 2013

golang - Profiling Go Programs 記錄(Part 5)

結論

這裡用的 Profiling 方法跟在 Java 沒什麼太大差別,仍是使用工具找出程式與資源間的關系, 會需要看點 Go 函式庫源始碼, 還好 Go net/http 函式庫的程式碼大部份都不會很長還滿好懂,過程也沒遇到什麼奇怪的狀況。

內建的 Profiling 工具某方面比 Java 內建的 JVisualVM 還要強大,能顯示關系圖,把數據與程式碼並列,像 block profiling 功能還是在 Solaris Studio 才有的進階選項, 雖然功能相較其它成熟語言的分析工具來的少,但一般狀況夠用了。

GC 目前沒找到專門的工具, 目前只能印出 gclog 來看數據,當 GC 頻率高的時候 log 就不好讀了,於是另外做了兩個小工具來協助分析。 profilingtool.go log2csv

其它一些 profiling 過程遇到零碎問題與解決方沒寫在文章裡,直接舉列在下方清單

Gotcha

  1. defer func 堆疊在 function return 時才會釋放, 若包在迴圈使用沒釋放的話,profiling 時候會看到 堆了很多 newdefer 跟 deferproc (由於忘了在哪裡踩到的,就沒寫在文章裡)

Standard Library

  1. net 底下的 read/write 都是跑 asynchronous 的,所以 cpu profiling 展開 gosched0 後會是各別 goroutine 的執行片段,片段之間的連帶關係還是要靠自已去抓出來的,工具沒那麼聰明
  2. Go1.1 有 timer.Reset 可以減少 Timer 重建
  3. 預設的 http package 裡沒有提供 timeout api,要把 http.Client 裡的 http.RoundTripper 整組換掉才能做到各階段連線與讀寫傳輸的 timeout 控制

Runtime

  1. GC & Goroutine scheduling 不是 free 的, pprof 是抓漏好幫手
  2. 目前 GC 實作還是陽春了點,能調效 latency 的手段有限
  3. GC 可以過透過 GOGC=off(or SetGCPercent(-1)) 配合 mem profiler 分析完整的 heap 配置狀況
  4. channel send/recv 跟 select 的 contention 會造成瓶頸,不過還沒遇到這種狀況,表面的知道
    • cpu profiling 可以觀察有這類操作在消耗 cpu 資源,進而分析要不要調整 channel 的 buffer size,或是更換同步方式與演算法
      • runtime.xchg / selectgo
      • runtime.chanrecv
      • runtime.chansend
    • block profiling 可以看 goroutine 被 block 的 delay 時間

Tool

  1. 內建的 go test 有提供 benchmark 的測試方法, 也能參數化加入 profiler, 有寫了一些但還是覺得整合的壓力測試不太會寫...

Other Issues

  1. 預設的 Http over TLS CPU吃很兇,有查到問題後就沒再試下去

TODO

  1. 多核環境(>8)觀察 contention 與 GC 效能

Reference:

  1. Profiling Go Programs

Apr 18, 2013

golang - Profiling Go Programs 記錄(Part 4)

4. 快取計算結果

第2與3項只修正 bug 但對效能沒有直接改善,以目前的觀測結果,程式向系統申請的記憶體用量還有點高(350M左右), 接著來檢查 GC 與 heap 狀況看哪些物件申請了這些記憶體

用 GOGCTRACE=1 讓 GO runtime 把 gclog 印出來,將印出的訊息傳給 log2csv 轉成 csv 檔案

$ GOGCTRACE=1 ./gb -c 100 -n 200000 -k http://localhost/10k.dat 2>&1 | log2csv -t -o gc.csv
unixtime,numgc,nproc,mark,sweep,cleanup,heap0,heap1,obj0,obj1,nmalloc,nfree,nhandoff,nhandoffcnt,nsteal,nstealcnt,nprocyield,nosyield,nsleep
1366278874.698135,1,1,0,0,0,0,0,24,26,27,1,0,0,0,0,0,0,0
1366278874.701761,2,2,1,0,0,2,2,608,518,642,124,0,0,5,31,22,4,0
1366278874.707143,3,2,4,0,0,4,4,993,985,1118,133,0,0,2,41,22,15,6
1366278874.725975,4,2,6,0,0,9,9,36182,36148,36317,169,6,187,2,78,70,24,17
1366278874.767119,5,2,13,0,0,18,18,113518,113518,113688,170,3,87,2,301,42,23,21
1366278874.837911,6,2,16,1,0,37,37,268246,268246,268417,171,4,93,2,48,54,20,11
1366278874.982132,7,2,35,2,0,75,75,577694,577694,577866,172,6,287,2,306,42,23,31
1366278875.267363,8,2,67,5,1,150,150,1196615,1196615,1196788,173,5,182,2,2063,32,23,11
1366278877.850924,9,2,64,35,8,301,154,2212070,1183694,2284625,1100931,8,502,13,16101,16,14,2
1366278879.561168,10,2,63,23,5,309,147,2233288,1119515,3411483,2291968,2,47,4,10961,32,16,13
1366278881.097839,11,2,70,40,2,294,139,2121182,1054221,4486980,3432759,2,17,4,17879,32,5,0
1366278882.543087,12,2,57,24,7,278,131,2000935,993438,5503542,4510104,1,2,3,9999,19,12,12
1366278883.873273,13,2,48,25,2,262,124,1888388,935583,6464524,5528941,3,152,2,10759,26,22,2
(略)

gc.csv 再用 gnuplot 將 csv 檔案裡的數據繪制成圖表 gnuplot-heap.p

$ gnuplot gnuplot-heap.p

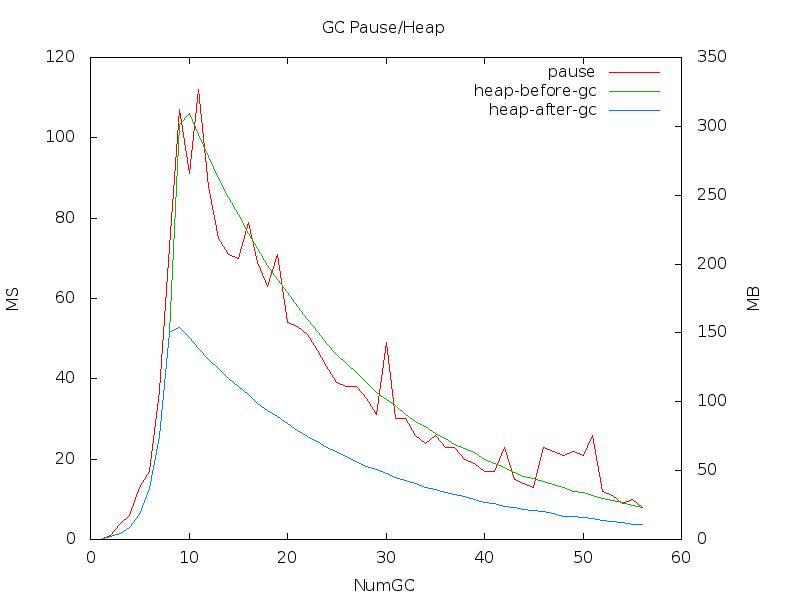
看起來是程式開始申請了過量的記憶體,GC 清空後 runtime 也沒把多餘的空間再還給作業系統, 再分析 gc.csv 後找到大量申請時間約在第6-10次gc, 於程式啟動後第5秒的時候達到最大值

為了要找出開始大量申請空間的物件,下面的程式在第1秒與第7秒各 dump 一次 heap

func main() {
    SetMemProfileRate(1)
    go func() {
        time.Sleep(time.Duration(1) * time.Second)
        DumpHeap()
        time.Sleep(time.Duration(6) * time.Second)
        DumpHeap()
    }()
    // ignored
    PrintGCSummary()
}
$ ./gb -c 100 -n 200000 http://localhost/10k.dat
(略)
NumGC:56 Pause:113.57ms Pause(Avg):425.33ms Overhead:30.54% Alloc:22.53M Sys:662.14M Alloc(Rate):43.24M/s Histogram:996.58ms 1.07s 1.07s 

在 go tool pprof 加上 --base 顯示兩個 profile 相減後的數據

$ go tool pprof ./gb --base heap-19221-1.pprof heap-19221-2.pprof 
(pprof) top
Total: 74.3 MB
    35.6  47.9%  47.9%     35.6  47.9% net/textproto.MIMEHeader.Set
    26.3  35.4%  83.3%     37.1  50.0% net/http.NewRequest
    10.8  14.6%  97.9%     10.8  14.6% net/url.parse
     1.5   2.1% 100.0%      1.5   2.1% net/textproto.MIMEHeader.Add
     0.0   0.0% 100.0%      0.0   0.0% resizefintab
     0.0   0.0% 100.0%      0.0   0.0% itab
     0.0   0.0% 100.0%      0.0   0.0% os.NewFile
     0.0   0.0% 100.0%      0.0   0.0% concatstring
(pprof) top -cum
Total: 74.3 MB
     0.0   0.0%   0.0%     74.3 100.0% gosched0
     0.0   0.0%   0.0%     74.3 100.0% main.(*Benchmark).Run
     0.0   0.0%   0.0%     74.3 100.0% main.NewHttpRequest
     0.0   0.0%   0.0%     74.3 100.0% main.main
     0.0   0.0%   0.0%     74.3 100.0% main.startBenchmark
     0.0   0.0%   0.0%     74.3 100.0% runtime.main
    26.3  35.4%  35.4%     37.1  50.0% net/http.NewRequest
     0.0   0.0%  35.4%     35.6  47.9% net/http.Header.Set
    35.6  47.9%  83.3%     35.6  47.9% net/textproto.MIMEHeader.Set
     0.0   0.0%  83.3%     10.8  14.6% net/url.Parse

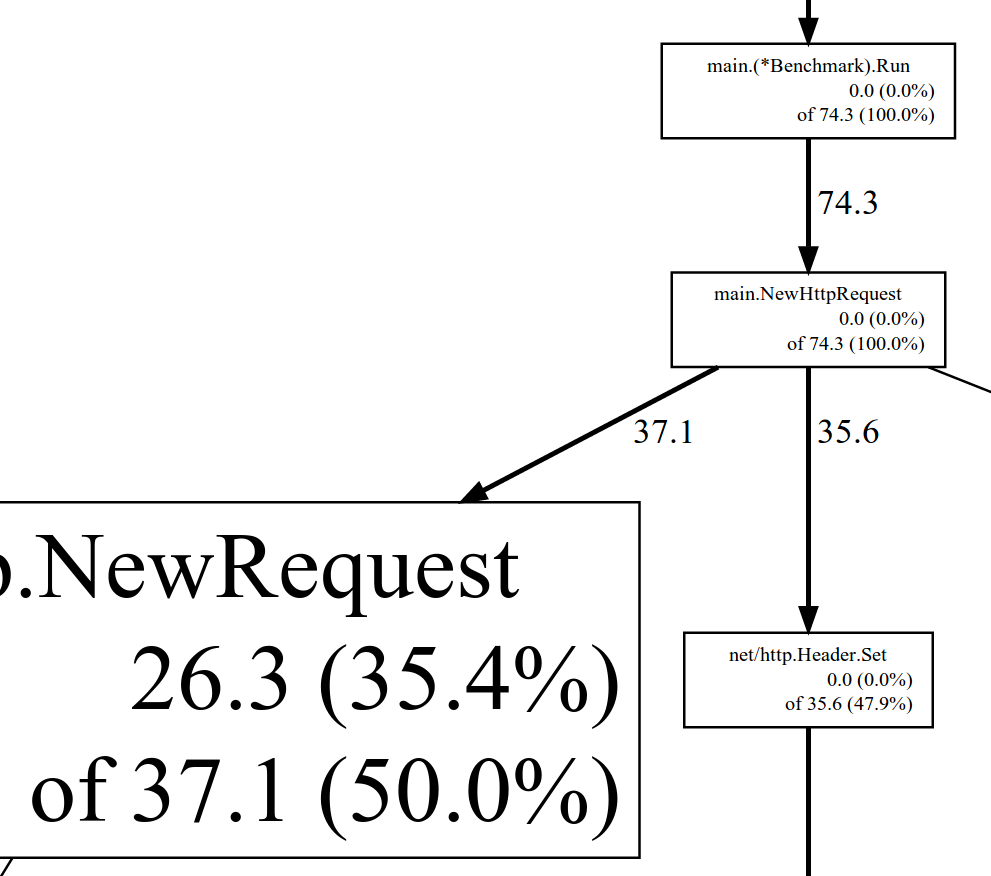
比較兩個 heap 過後,總共增加了 74.3 MB,從top -cum顯示這 74.3MB 100.0% 是 main.(*Benchmark).Run 底下產生的

(pprof) web main.\(\*Benchmark\).Run

SVG File

(pprof) list main.\(\*Benchmark\).Run
Total: 74.3 MB
ROUTINE ====================== main.(*Benchmark).Run in /home/brandon/workspaces/go/src/bench/gb/benchmark.go
   0.0   74.3 Total MB (flat / cumulative)
     .      .   27:     monitor := NewMonitor(config, collector, start, stop)
     .      .   28: 
     .      .   29:     return &Benchmark{config, collector, monitor, start, stop}
     .      .   30: }
     .      .   31: 
---
     .      .   32: func (b *Benchmark) Run() {
     .      .   33: 
     .      .   34:     go b.monitor.Run()
     .      .   35: 
     .      .   36:     jobs := make(chan *http.Request, b.config.requests)
     .      .   37: 
     .      .   38:     for i := 0; i < b.config.concurrency; i++ {
     .      .   39:         go NewHttpWorker(b.config, jobs, b.collector, b.start, b.stop).Run()
     .      .   40:     }
     .      .   41: 
     .      .   42:     for i := 0; i < b.config.requests; i++ {
     .   74.3   43:         newRequest, _ := NewHttpRequest(b.config)
     .      .   44:         jobs <- newRequest
     .      .   45:     }
     .      .   46:     close(jobs)
     .      .   47: 
     .      .   48:     close(b.start)
     .      .   49:     <-b.stop
     .      .   50: }
---
(pprof)

main.(*Benchmark).Run 的 L:43 NewHttpRequest 增加了 74.3 MB 的記憶體,從程式行為來分析,問題是L:42的迴圈在一開始就產生了所有 NewHttpRequest,另一個是 NewHttpRequest 是個昂貴的操作為了建立 http.NewRequest 衍生使用了 textproto.MIMEHeader.Set 與 net/url.parse

優化方法:複製 httpRequest 結果避免同樣的計算與空間浪費

func (b *Benchmark) Run() {

    go b.monitor.Run()

    jobs := make(chan *http.Request, b.config.requests)

    for i := 0; i < b.config.concurrency; i++ {
        go NewHttpWorker(b.config, jobs, b.collector, b.start, b.stop).Run()
    }
    base, _ := NewHttpRequest(b.config)
    for i := 0; i < b.config.requests; i++ {
        newRequest := CopyHttpRequest(b.config, base)
        jobs <- newRequest
    }
    close(jobs)

    close(b.start)
    <-b.stop
}

func CopyHttpRequest(config *Config, request *http.Request) *http.Request {

    if config.method == "POST" || config.method == "PUT" {
        newRequest := *request
        if newRequest.Body != nil {
            newRequest.Body = ioutil.NopCloser(bytes.NewReader(config.bodyContent))
        }
        return &newRequest
    } else {
        return request
    }

}

執行結果

$ ./gb -c 100 -n 200000 -k http://localhost/10k.dat
(略)
Document Path:          /10k.dat
Document Length:        10240 bytes

Concurrency Level:      100
Time taken for tests:   12.14 seconds
Complete requests:      200000
Failed requests:        0
HTML transferred:       2048000000 bytes
Requests per second:    16471.31 [#/sec] (mean)
Time per request:       6.071 [ms] (mean)
Time per request:       0.061 [ms] (mean, across all concurrent requests)
HTML Transfer rate:     164713.14 [Kbytes/sec] received

Connection Times (ms)
              min   mean[+/-sd] median  max
Total:        0         0   3.50    4   38

Percentage of the requests served within a certain time (ms)
 50%     4
 66%     5
 75%     7
 80%     7
 90%     10
 95%     12
 98%     14
 99%     17
 100%    38 (longest request)

NumGC:49 Pause:6.15ms Pause(Avg):7.52ms Overhead:3.00% Alloc:18.19M Sys:284.25M Alloc(Rate):64.70M/s Histogram:10.50ms 13.11ms 13.11ms
$ echo "  PID USER      PR  NI  VIRT  RES  SHR S  %CPU %MEM    TIME+  COMMAND";  top -d 1 -b | grep gb
  PID USER      PR  NI  VIRT  RES  SHR S  %CPU %MEM    TIME+  COMMAND
 9529 brandon   20   0  732m  20m 2860 S  29.7  0.1   0:00.30 gb
 9529 brandon   20   0  942m  23m 2864 S 103.6  0.1   0:01.35 gb
 9529 brandon   20   0 1016m  24m 2864 S 105.1  0.2   0:02.41 gb
 9529 brandon   20   0 1016m  24m 2864 S 103.5  0.2   0:03.46 gb
 9529 brandon   20   0 1088m  25m 2864 S 104.1  0.2   0:04.51 gb
 9529 brandon   20   0 1088m  25m 2864 S 104.0  0.2   0:05.56 gb
 9529 brandon   20   0 1088m  26m 2864 S 102.2  0.2   0:06.59 gb
 9529 brandon   20   0 1088m  26m 2864 S 103.8  0.2   0:07.64 gb
 9529 brandon   20   0 1160m  26m 2864 S 104.2  0.2   0:08.69 gb
 9529 brandon   20   0 1160m  26m 2864 S 105.1  0.2   0:09.75 gb
 9529 brandon   20   0 1160m  27m 2864 S 103.2  0.2   0:10.79 gb
 9529 brandon   20   0 1160m  27m 2864 S 103.1  0.2   0:11.83 gb

向系統申請記憶體終於在這次測試裡降下來(25MB vs 350MB),平均 GC 停頓時間也降低(7.52ms vs 40.91ms)
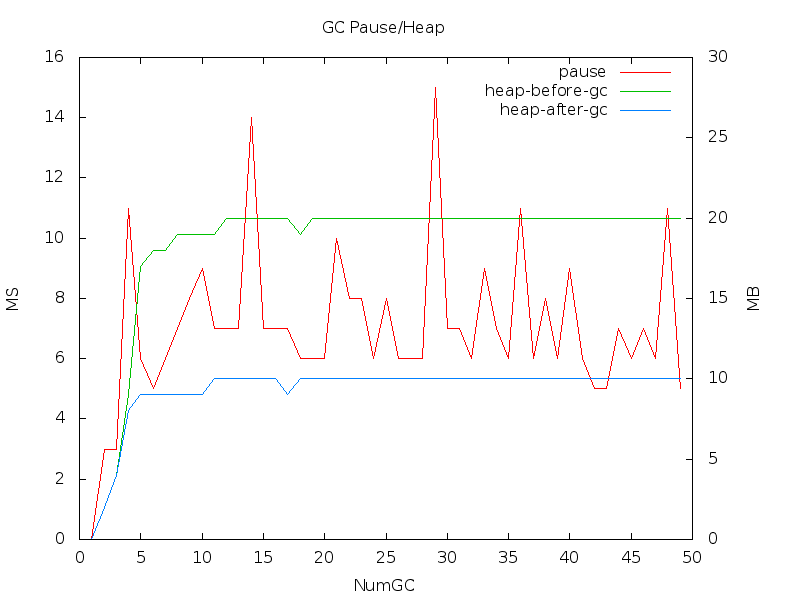
gc2.csv

golang - Profiling Go Programs 記錄(Part 3)

3. 正常結束 Goroutine

$ go tool pprof ./gb heap-6438-1.pprof
(pprof) top10
Total: 8.6 MB
     1.5  17.8%  17.8%      3.0  35.3% main.(*Benchmark).Run
     1.5  17.8%  35.6%      1.5  17.8% main.(*Monitor).Run
     1.5  17.8%  53.4%      1.5  17.8% main.NewBenchmark
     1.5  17.5%  70.9%      1.5  17.5% net/textproto.MIMEHeader.Set
     1.0  11.7%  82.5%      1.0  11.7% bufio.NewReaderSize
     1.0  11.7%  94.2%      1.0  11.7% bufio.NewWriterSize
     0.5   5.8% 100.0%      0.5   5.8% newdefer
     0.0   0.0% 100.0%      0.5   5.8% bufio.(*Writer).Flush
     0.0   0.0% 100.0%      1.0  11.7% bufio.NewReader
     0.0   0.0% 100.0%      1.0  11.7% bufio.NewWriter

程式結束前仍有 8.6 MB 的 object 沒有被 GC 回收,但從搜集到的 heap 資訊看不出來有任何存在的 object reference 改從 goroutine 的 callstack 來追查是否為這些物件的 GC root

func main() {
    SetMemProfileRate(1) //(請參考第一篇附件 profilingtool.go)
    // ignored
    GC()    
    DumpHeap()
    PrintGCSummary()
    panic("show me the callstack")
}

在 Go 裡面只要不去攔截 panic 訊息就會把所有的 goroutine callstack 都印出來, 所以這裡降低 gorutine 的數量並且把輸出訊息導到 err.log 避免 terminal buffer 不足導致訊息被清掉

$ ./gb -c 2 -n 10 -k http://localhost/10k.dat 2>&1 | tee err.log
(略)

goroutine 1 [running]:
main.main()
    /home/brandon/workspaces/go/src/bench/gb/gb.go:66 +0x129

(略)
goroutine 9 [chan receive]:
main.(*HttpWorker).Run(0xc200098e00)
    /home/brandon/workspaces/go/src/bench/gb/http.go:37 +0x57
created by main.(*Benchmark).Run
    /home/brandon/workspaces/go/src/bench/gb/benchmark.go:39 +0xbb

goroutine 10 [chan receive]:
main.(*HttpWorker).Run(0xc200098e40)
    /home/brandon/workspaces/go/src/bench/gb/http.go:37 +0x57
created by main.(*Benchmark).Run
    /home/brandon/workspaces/go/src/bench/gb/benchmark.go:39 +0xbb
(略)

從 callstacks 可以看到 goroutine 9 / 10 的狀態都是 [chan receive] 並且停在 http.go:37

func (h *HttpWorker) Run() {
    <-h.start

    for job := range h.jobs { // L:37
        //ignored
        go h.send(job)
        //ignored
    }
}

狀況是 worker 在等 jobs channel 的 job,而 Benchmark 也已經結束不再傳送 job 給 jobs channel

修正方法

func (b *Benchmark) Run() {

    go b.monitor.Run()

    jobs := make(chan *http.Request, b.config.requests)

    for i := 0; i < b.config.concurrency; i++ {
        go NewHttpWorker(b.config, jobs, b.collector, b.start, b.stop).Run()
    }

    for i := 0; i < b.config.requests; i++ {
        request, _ := NewHttpRequest(b.config)
        jobs <- request
    }
    close(jobs) // 已經不會再建立新 job 就可以關了, 別讓接收 job 的 httpworker 讓空的 jobs channel 給卡住

    close(b.start)
    <-b.stop
}

執行結果

$ ./gb -c 100 -n 200000 -k http://localhost/10k.dat
$ go tool pprof ./gb heap-32397-1.pprof
(pprof) top
Total: 0.2 MB
     0.0  30.6%  30.6%      0.0  30.6% runtime.cnew
     0.0  14.9%  45.5%      0.0  15.4% main.NewHttpWorker
     0.0  12.2%  57.8%      0.0  12.2% newdefer
     0.0   7.5%  65.3%      0.0   7.5% bufio.NewReaderSize
     0.0   7.5%  72.7%      0.0   7.5% bufio.NewWriterSize
     0.0   4.9%  77.6%      0.0   4.9% io/ioutil.blackHole
     0.0   4.8%  82.4%      0.0  24.8% net/http.(*Transport).dialConn
     0.0   3.5%  85.9%      0.0   3.5% runtime.malg
     0.0   1.2%  87.1%      0.0   1.2% net/textproto.(*Reader).ReadMIMEHeader
     0.0   1.1%  88.2%      0.0   1.6% flag.(*FlagSet).Var

程式離開前的記憶體從 8.6 MB 降到 0.2 MB